ufind.best ufind.best

Searching our database...

Navigate Select
Search by name or category
Plotox Logo

Create Interactive and Professional charts from CSV data instantly

Screenshot 1 of Plotox Screenshot 2 of Plotox Screenshot 3 of Plotox Screenshot 4 of Plotox

A placing, not a percentage: #3 of the 19 tools that launched that week. First place reads 90, last reads 35, and the scores compare only within one week.

Judged 28 September 2026 under measure 2026-09-08.v25. Scores compare products within one launch week. We keep making the judges' questions stricter, so a score from another week was set against a different measure.

Market signal

Demand proven, distinction limited

Demand is visible; product differentiation is the main constraint. The research snapshot found 4 direct and 0 adjacent alternatives.

Existing Jury ratings
Demand Mercury
81
Differentiation Uranus
50
Product strength Execution, UX, Trust & Practical value
87
Market scope Market scope unclear

No reliable geographic or language constraint was visible in the public product information.

Similar tools found

4 direct · 0 adjacent

4
Active market Mixed approaches Broad comparison
Same market 4

Visible approaches: online chart maker, browser-based CSV chart maker, AI chart generator.

Examples: InstaCharts, Kanaries, Keptune, LiveGap Charts

Named alternatives found in this public research snapshot, not a complete market census. The count and approach mix explain the review and add no points.

Research coverage Broad coverage
86

The snapshot spans the main research angles and several independent platforms.

Pain 2 Demand 3 Alternatives 5 Quality 2

Specialist score profile

All six ratings
Demand 81 Uniqueness 50 Execution 90 UX 87 Trust 81 Value 90

Each spoke is one independent specialist. A smaller side makes the main constraint visible immediately.

This report explains the published specialist ratings and 12 public sources across 10 platforms. Research coverage is not an extra score and adds no points.

Execution

Mars specialist · 15%

#1 of 19 90/100

Top execution this week

Placed first because the capture confirms a live in-browser chart builder with upload controls, chart types, and a working app screen, giving stronger direct execution proof than any product below. Total: 5/5.

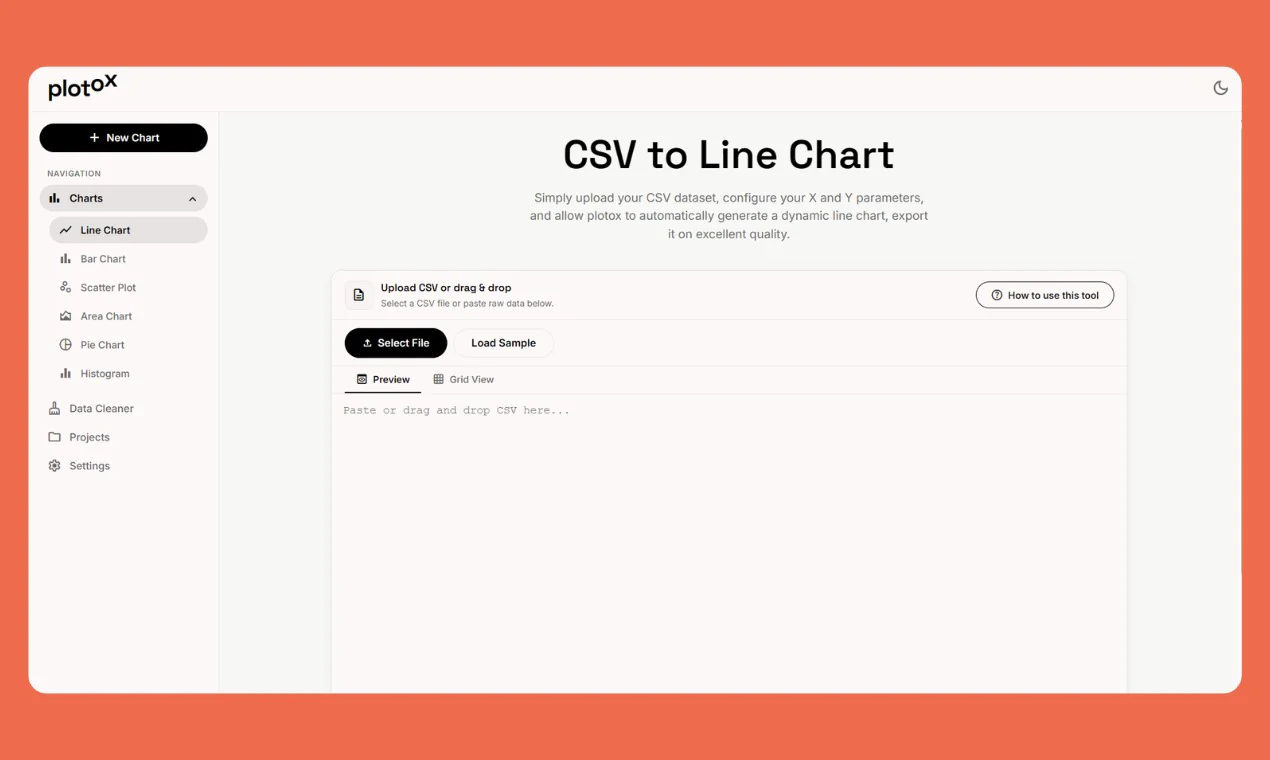
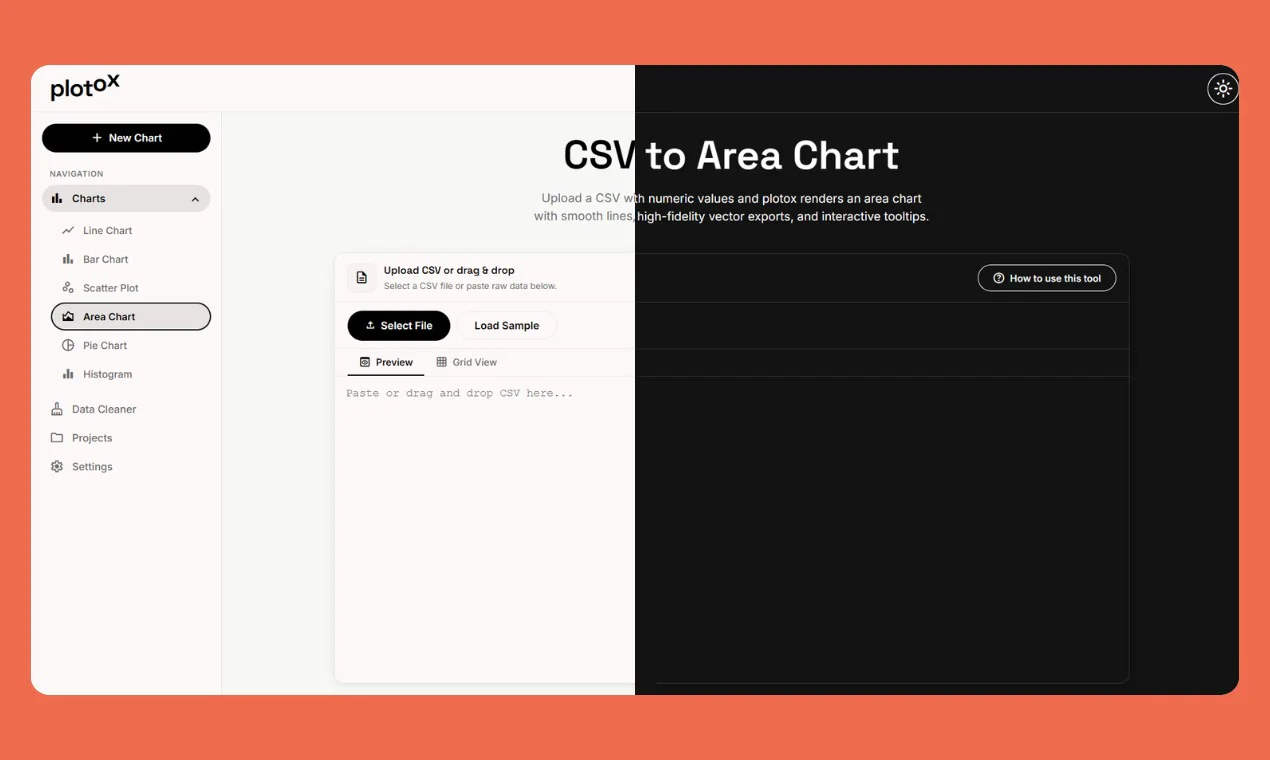
  • A live dashboard page is shown with CSV upload, sample loading, chart-type navigation, and preview/grid controls. Product page

User experience

Venus specialist · 10%

#2 of 19 87/100

Total 4/5. It clearly says CSV to chart, shows a readable working app after one click, and has no gate. It sits below P18 because the first screen only links to the tool and uses generic labels like “Try for free” and “Get Started.”

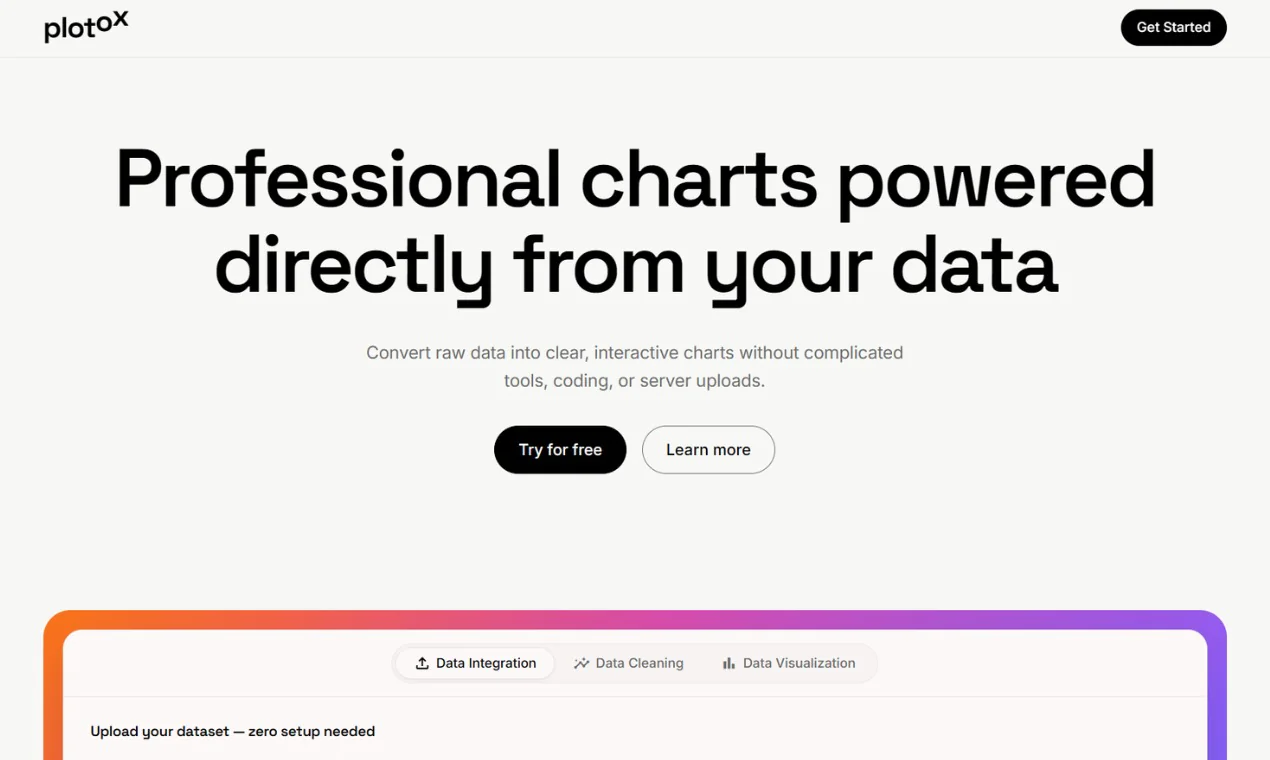
  • Landing page headline and description state CSV/Excel data becomes interactive charts and dashboards. Product page
  • Visible first actions are “Try for free,” “Learn more,” and “Get Started,” which do not name the output. Product page
  • The linked app opens directly to a readable chart builder with “Upload CSV or drag & drop” and “Select File,” without sign-up. Product page

Trust

Saturn specialist · 10%

#4 of 19 81/100

Above P10 because its main promise is simpler and visibly fulfilled by the reachable app; below P13 because ownership and support transparency are thinner and featured-on badges are not strong evidence.

  • Largest claim is turning CSV/Excel data into interactive charts and dashboards in seconds with no uploads; reachable app shows CSV upload, chart types, dashboard builder, and data... Product page
  • Landing page states runs 100% in your browser and no signup; app is directly accessible from Get Started. Product page
  • Privacy Policy and Terms of Service are linked in footer, but ownership/support details are minimal. Product page

Uniqueness

Uranus specialist · 30%

#14 of 19 50/100

Above the next product only because the fully browser-run, no-upload privacy angle is visible, but I could not name a charting capability that same-market CSV chart makers lack. Most differences here look like packaging, not uniqueness.

  • Product turns CSV or Excel into interactive charts and dashboards in seconds and runs 100% in the browser with no uploads or signup. Product page
  • Alternative Kanaries is also described as a browser-based CSV chart maker that avoids sending private data elsewhere. kanaries.net

Practical value

Jupiter specialist · 10%

#1 of 19 90/100

Top practical value this week

It places above P19 because the visitor clearly ends up with a generated chart or dashboard from their own CSV, immediately in-browser with no signup, and the page explicitly says charts can be exported—named work someone might otherwise pay an analyst or designer for. Total: 4.5/5.

  • The product is described as turning CSV or Excel data into interactive charts and dashboards in seconds. Product page
  • The app page shows CSV upload/paste and chart generation tools with no signup gate visible. Product page
  • The page description says it runs 100% in the browser with no uploads and no signup. Product page

Market demand

Mercury specialist · 25%

#4 of 19 81/100

CSV-to-chart creation ranks fourth because many people periodically turn spreadsheet exports into visuals, usually monthly or ad hoc. Total 4/5; it edges home-management below on broader existing manual workarounds and a need less tied to owning connected devices.

  • Job: turn CSV or Excel data into interactive charts and dashboards; typical user frequency is monthly or ad hoc, not clearly weekly. Product page
  • Independent evidence shows people asking how to create charts from CSV files and describing Excel macro workarounds. stackoverflow.com stackoverflow.com
  • Same-market alternatives specifically offer browser-based CSV-to-chart creation without coding, showing the job already exists in this exact format. instacharts.io kanaries.net charts.livegap.com

Every specialist function rates every launch. A weekly category leader label marks the highest score in that measure, can be shared on an exact tie, and adds no extra points.

How weekly voting works

No Deals Available

Currently, there are no special deals or discounts available for this tool.

Asking Price

$17,000

Contact Seller

TTM Revenue

$0

TTM Profit

$0

Last month revenue

$0

Business Details

Date founded
2025-04-01
Team Size
1
Contact Email
[email protected]
Tech Stack
Wasp, React, Shadcn-UI + TailwindCSS, Prisma + Postgres, hosted on fly.io